Modules
MCRA is a modular system. The diagram of Figure 9 shows the modules and their relations. Each module is associated with its own type of data, and is linked to one or more other modules. Note that not all details can be fully shown in the scheme, for details consult the table below, which specifies all relations between the modules in MCRA.
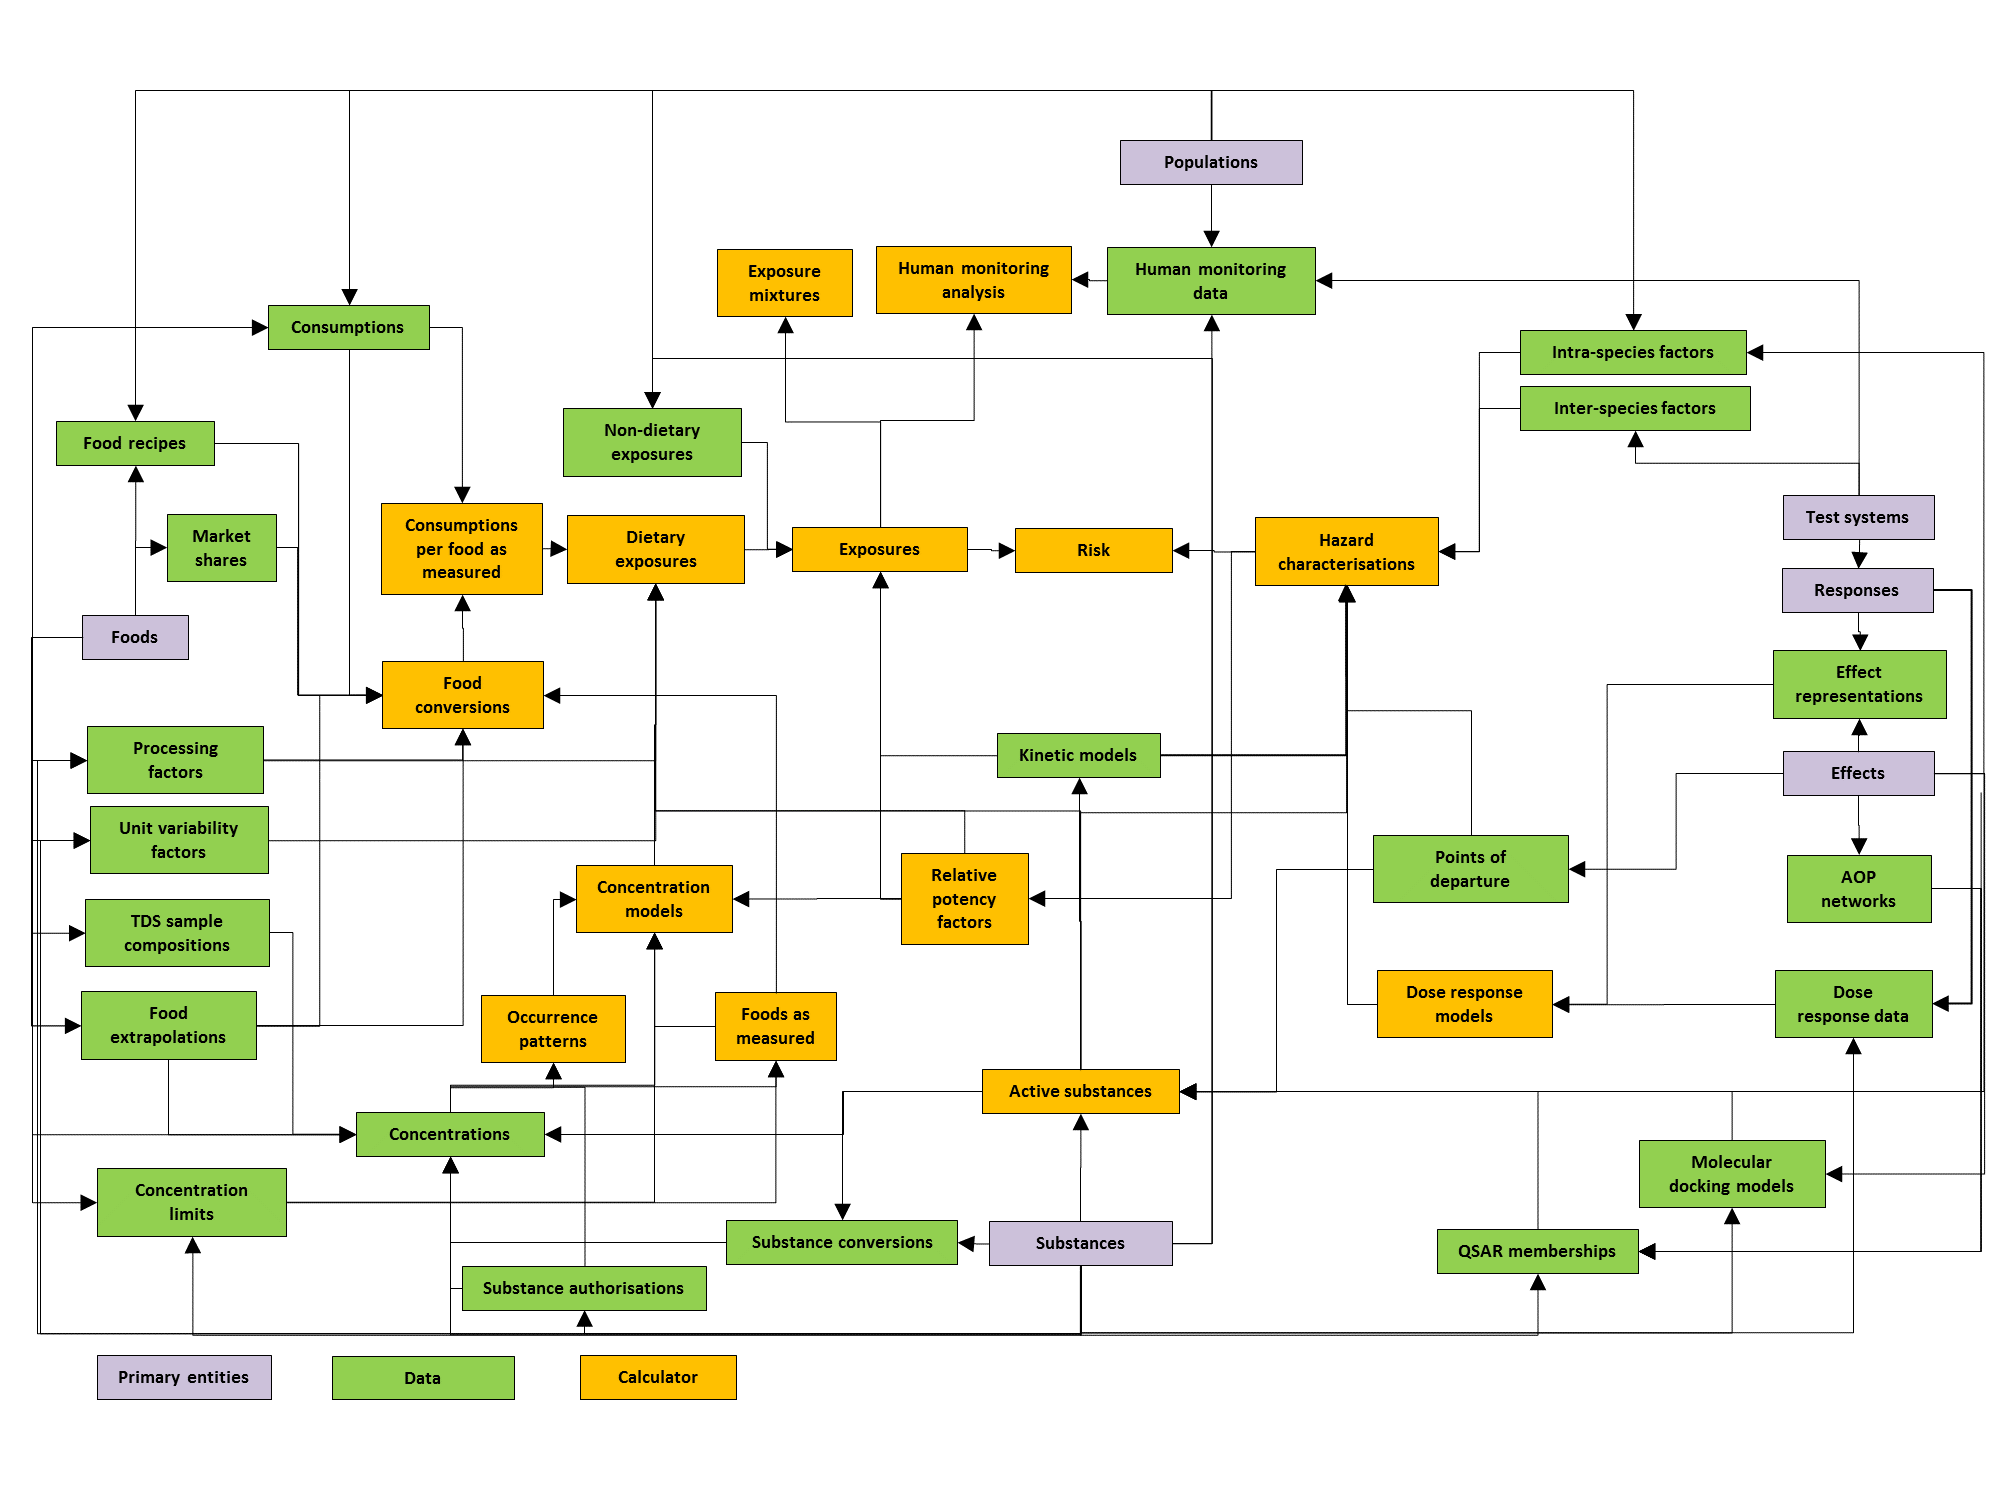
Figure 9 Diagram of the modular design of MCRA.
| Category | Module | Inputs | Used by | Description |
|---|---|---|---|---|
| Primary entities | Foods | Consumptions, Market shares, Food recipes, Concentrations, Processing factors, Unit variability factors, Occurrence patterns, Substance authorisations, Concentration limits, Concentration models, Foods as measured, Total diet study sample compositions, Food extrapolations, Food conversions, Consumptions by food as measured, Dietary exposures with screening, Dietary exposures, Exposures, Exposure mixtures. | Foods are uniquely defined sources of dietary exposure to chemical substances. Foods may refer to 1) foods-as-eaten: foods as coded in food consumption data (e.g. pizza); 2) foods-as-measured: foods as coded in concentration data (e.g. wheat); 3) any other type of food (e.g. ingredients, e.g. flour). | |
| Substances | Concentrations, Processing factors, Unit variability factors, Occurrence patterns, Substance authorisations, Substance conversions, Concentration limits, Concentration models, Foods as measured, Food conversions, Consumptions by food as measured, Dietary exposures with screening, Dietary exposures, Non-dietary exposures, Exposures, Exposure mixtures, Human monitoring data, Human monitoring analysis, QSAR membership models, Molecular docking models, Kinetic models, Active substances, Relative potency factors, Hazard characterisations, Points of departure, Dose response models, Dose response data, Inter-species conversions, Intra species factors, Risks. | Substances are chemical entities that can refer to: 1) active substances such as investigated in toxicology; 2) measured substances such as defined in specific analytical methods. MCRA assessments can have one or more substances as the scope. When more than one substance is specified, there is an option to perform a cumulative assessment. In that case one of the substances has to be indicated as the index/reference substance, and results will be expressed in equivalents of the index substance. | ||
| Effects | Concentration models, Dietary exposures with screening, Dietary exposures, Exposure mixtures, QSAR membership models, Molecular docking models, Active substances, Relative potency factors, Hazard characterisations, Points of departure, Effect representations, Inter-species conversions, Intra species factors, AOP networks, Risks. | Effects are biological or toxicological consequences for human health, that may result from chemical exposure and are the focus of hazard or risk assessment. | ||
| Populations | Consumptions, Consumptions by food as measured, Dietary exposures, Non-dietary exposures, Exposures, Human monitoring analysis, Risks. | Populations are groups of human individuals that are the scope of exposure or risk assessments. Optional descriptors of populations are location (e.g. a country), time period (start date, end date), age range and gender. Example: the French population in 2005-2007 of women of child-bearing age (18-45 yr). | ||
| Test systems | Responses, Dose response models, Dose response data. | Test systems are biological or artificial systems used for assessing hazard in relation to chemical exposure from substances in varying doses. Test systems may refer to 1) in-vivo test systems (e.g. a rat 90-day study, a human biomonitoring study); 2) in-vitro test systems (e.g. HepaRG cells). | ||
| Responses | Test systems. | Dose response models, Dose response data, Effect representations. | Responses are measurable entities in test systems. Responses are used to represent effects (see effect representations) and their measured values are collected in dose response data. | |
| Consumption | Consumptions | Populations, Foods. | Food conversions, Consumptions by food as measured. | Consumptions data are the amounts of foods consumed on specific days by individuals in a food consumption survey. |
| Market shares | Foods. | Food conversions. | Market shares data specify for a given food, percentages of more specific foods (subfoods, e.g. brands) representing their share in a market. Market shares are used when consumption data are available at a more generalised level than concentration data. | |
| Food recipes | Foods. | Food conversions. | Food recipes data specify the composition of specific foods (typically: foods-as-eaten) in terms of other foods (intermediate foods or foods-as-measured) by specifying proportions in the form of a percentage. | |
| Occurrence | Concentrations | Foods, Substances, Focal food concentrations, Food extrapolations, Substance conversions, Relative potency factors, Substance authorisations, Active substances, Concentration limits. | Occurrence patterns, Concentration models, Foods as measured. | Concentrations data are analytical measurements of chemical substances occurring in food samples. In their simplest form, concentration data can just be used as provided by datasets. Optionally, concentrations data can be manipulated for active substances, extrapolated to other foods, and/or default values can be added for water. |
| Processing factors | Foods, Substances. | Food conversions, Dietary exposures. | Processing factors are multiplication factors to derive the concentration in a processed food from the concentration in an unprocessed food and can be specified for identified processing types (e.g., cooking, washing, drying). Processing factors are primarily used in dietary exposure assessments to correct for the effect of processing on substance concentrations in dietary exposure calculations. | |
| Unit variability factors | Foods, Substances. | Dietary exposures. | Unit variability factors specify the variation in concentrations between single units of the same food, which have been put together in a mixture sample on which the concentration measurements have been made. Unit variability factors are used to account for the fact that concentration data often relate to composite samples, whereas an acute risk may result from single food units. | |
| Occurrence patterns | Foods, Substances, Concentrations, Substance authorisations, Active substances. | Concentration models. | Occurrence patterns (OPs) are the combinations (or mixtures) of substances that occur together on foods and the frequencies of these mixtures occurring per food, expressed in percentages. In the context of pesticides, occurrence patterns can be associated with agricultural use percentages. Occurrence patterns are relevant to account for co-occurrence of active substances in exposed individuals. Occurrence patterns may be specified as data or modelled based on observed patterns of positive concentrations. | |
| Substance authorisations | Foods, Substances. | Concentrations, Occurrence patterns. | Substance authorisations specify which food/substance combinations are authorised. If substance authorisations are used, then only the food/substance combinations that are specified in the data are assumed to be authorised and all other combinations are assumed to be not authorised. This information may, for instance, be used to determine whether concentration measurements below the LOR could be assumed true zeros. I.e., if a food/substance combinations is assumed to be unauthorised, then the LOR may be assumed to be a zero. | |
| Substance conversions | Substances, Active substances. | Concentrations. | Substance conversions specify how measured substances are converted to active substances, which are the substances assumed to cause health effects. In the pesticide legislation such measured substances and the substance conversion rules are known as residue definitions. | |
| Concentration limits | Foods, Substances. | Concentrations, Concentration models, Foods as measured. | Concentration limits specify (legal) limit values for substance concentrations on foods and are sometimes used as conservative values for concentration data. In the framework of pesticides the legal Maximum Residue Limit (MRL) is the best known example. | |
| Concentration models | Concentrations, Concentration limits, Foods as measured, Occurrence patterns, Relative potency factors. | Dietary exposures with screening, Dietary exposures. | Concentration models are distributional models of substance concentrations on foods. They describe both the substance presence (yes/no, with no representing an absolute zero concentration) and the substance concentrations. Concentration models are specified per food/substance combination. | |
| Foods as measured | Concentrations, Concentration limits. | Concentration models, Food conversions. | Foods as measured are foods within the foods scope for which concentration data of substances are available (or expected). | |
| Focal food concentrations | Concentrations. | In some cases the attention in an assessment is on a specific food (focal food), against the background of other foods. Focal food concentrations are separate concentration data for one or more focal food commodities, that will take the place of any other concentration data for the focal food in the ordinary concentrations data. | ||
| Total diet study sample compositions | Foods. | Food conversions. | Total diet study sample compositions specify the composition of mixed food samples, such as used in a total diet study (TDS), in terms of their constituting foods. | |
| Food extrapolations | Foods. | Concentrations, Food conversions. | Food extrapolations data specify foods (from-foods) that can be used to impute concentration data for other foods with insufficient data (to-foods). | |
| Exposure | Food conversions | Consumptions, Foods as measured, Processing factors, Food recipes, Market shares, Food extrapolations, Total diet study sample compositions, Active substances. | Consumptions by food as measured. | Food conversions relate foods-as-eaten, as found in the consumption data, to foods-as-measured, which are the foods for which concentration data are available. A food-as-eaten can be linked to one, or multiple food-as-measured using various conversion steps (e.g., using food recipes to translate a composite food to its ingredients, or using processing information to relate a processed food to its unprocessed form). There are several types of conversion steps, and a conversion path may comprise multiple conversion steps between a food-as-eaten and a food-as-measured. |
| Consumptions by food as measured | Consumptions, Food conversions. | Dietary exposures with screening, Dietary exposures. | Consumptions by food as measured are consumptions of individuals expressed on the level of the foods for which concentration data are available (i.e., the foods-as-measured). These are calculated from consumptions of foods-as-eaten and food conversions that link the foods-as-eaten amounts to foods-as-measured amounts. | |
| Dietary exposures with screening | Consumptions by food as measured, Concentration models, Active substances, Relative potency factors. | Dietary exposures. | Dietary exposures with screening are just dietary exposures, but the calculation includes a prior screening step to identify the main risk drivers (food-substance combinations). This allows computations with more substances by suppressing some details for less important food-substance combinations. | |
| Dietary exposures | Consumptions by food as measured, Concentration models, Processing factors, Unit variability factors, Dietary exposures with screening, Active substances, Relative potency factors. | Exposures. | Dietary exposures are the amounts of substances, expressed per kg bodyweight or per individual, to which individuals in a population are exposed from their diet per day. Depending on the exposure type, dietary exposures can be short-term/acute exposures and then contain exposures for individual-days, or they can be long-term/chronic exposures, in which case they represent the average exposure per day over an unspecified longer time period. | |
| Non-dietary exposures | Populations, Substances, Active substances. | Exposures. | Non-dietary exposures are the amounts of substances to which individuals in a population are exposed via any of three non-dietary routes: dermal, inhalation or oral, per day. | |
| Exposures | Dietary exposures, Non-dietary exposures, Active substances, Relative potency factors, Kinetic models. | Exposure mixtures, Human monitoring analysis, Risks. | Exposures are amounts of substances, typically expressed per mass unit and per day, to which individuals in a population are exposed at a chosen target level. This target level may be external exposure (dietary exposure, expressed per unit body weight, or per person) or internal exposure (expressed per unit organ weight). Internal exposures may be aggregated from dietary and non-dietary exposures using either absorption factors or kinetic models to translate the external exposures to internal exposures. Exposures can be short-term/acute exposures and then contain exposures for individual-days, or they can be long-term/chronic exposures, in which case they represent the average exposure per day over an unspecified longer time period. | |
| Exposure mixtures | Exposures. | Exposure mixtures are mixtures of substances that contribute relatively much to the overall cumulative exposure (potential risk drivers). | ||
| Human monitoring data | Substances. | Human monitoring analysis. | Human monitoring data quantify substance concentrations found in humans collected in human monitoring surveys. | |
| Human monitoring analysis | Human monitoring data, Exposures. | Human monitoring analysis compares observed human monitoring data with predictions made for the same population of individuals from dietary survey data, concentration data and (optionally) non-dietary exposure data. | ||
| In-silico | QSAR membership models | Substances, Effects, AOP networks. | Active substances. | QSAR membership models specify assessment group memberships for active substances related to a specific health effect (adverse outcome). Memberships should be derived externally from Quantitative Structure-Activity Relationship (QSAR) models. |
| Molecular docking models | Substances, Effects, AOP networks. | Active substances. | Molecular docking models specify binding energies for substances in specific molecular docking models related to a specific health effect (adverse outcome). | |
| Kinetic | Kinetic models | Substances, Active substances. | Exposures, Hazard characterisations. | Kinetic models convert exposures or hazard characterisations from one or more external routes or compartments to an internal (target) compartment. The reverse conversion from internal to external can also be made (reverse dosimetry). |
| Hazard | Active substances | AOP networks, Points of departure, Molecular docking models, QSAR membership models. | Concentrations, Occurrence patterns, Substance conversions, Non-dietary exposures, Kinetic models, Food conversions, Dietary exposures with screening, Dietary exposures, Exposures, Hazard characterisations. | Active substances are substances that may lead (P>0) to a specific health effect (adverse outcome). Active substances can be specified directly as data or calculated from POD presence, QSAR models or Molecular docking models. Active substances can have an assessment group membership 1 (crisp), or values in the range (0,1] (probabilistic). |
| Relative potency factors | AOP networks, Hazard characterisations. | Concentrations, Concentration models, Dietary exposures with screening, Dietary exposures, Exposures. | Relative potency factors (RPFs) quantify potencies of substances with respect to a defined effect, relative to the potency of a chosen index substance. RPFs can be used to express combined exposures of multiple substances in terms of a the exposure value of the chosen index substance (i.e., in index substance equivalents). In MCRA, hazard characterisations, and therefore also RPFs are based on mass units (e.g., µg), and not on mol units. RPFs can be different for different levels of the human organism (external, internal, specific compartment). RPFs can be given as data or computed from hazard characterisations. RPFs can be specified with uncertainty. Computation from uncertain hazard characterisations allows to include correlations between uncertain RPFs which originate from using the same index substance. | |
| Hazard characterisations | AOP networks, Active substances, Dose response models, Effect representations, Points of departure, Inter-species conversions, Intra species factors, Kinetic models. | Relative potency factors, Risks. | Hazard characterisations are benchmark doses for active substances and for the chosen effect at the chosen target level (external or internal) of the hazard assessment. Hazard characterisations are based on points of departure, such as BMDs from dose-reponse models or externally specified points of departure (MDSs, NOAELs or LOAELs). The computation may involve inter-species conversion, intra-species factors and the use of kinetic models or absorption factors to convert external doses to internal doses. | |
| Points of departure | Substances, Effects, AOP networks. | Active substances, Hazard characterisations. | Externally specified points of departure can be used as an alternative to calculated BMDs from dose response models. Points of departure can be of various types, such as NOAEL, LOAEL or BMD. They can be used to construct the list of active substances, to derive relative potency factors, and to perform health impact assessments. | |
| Dose response models | Dose response data, Effect representations. | Hazard characterisations. | Dose response models are models fitted to dose response data and can be provided as data or calculated using a local or remote version of PROAST. The main results for hazard and risk assessment are benchmark doses (BMDs), related to a specified substance, response, optionally covariate value, and the benchmark response (BMR). | |
| Dose response data | Substances, Test systems, Responses. | Dose response models. | Dose response data are data on response values of test systems at specified doses of substances (or mixtures of substances) from dose response experiments. | |
| Effect representations | Effects, Responses, AOP networks. | Hazard characterisations, Dose response models. | Effect representations are the responses which can be used to measure specified effects and the benchmark response (BMR) that defines a hazard limit for the effect. | |
| Inter-species conversions | Substances, Effects. | Hazard characterisations. | Inter-species conversions specify how to convert a hazard characterisation for a given species to a hazard characterisation for humans. In the simplest approach, this specifies a fixed inter-species factor. In a higher tier, this specifies a geometric mean (GM) and geometric standard deviation (GSD) for a lognormal uncertainty distribution of the interspecies factor. Inter-species conversion are specified per effect and can be general or substance-specific. | |
| Intra species factors | Substances, Effects. | Hazard characterisations. | Intra-species factors specify how to convert a hazard characterisation from the average to a sensitive human individual. | |
| AOP networks | Effects. | QSAR membership models, Molecular docking models, Active substances, Relative potency factors, Hazard characterisations, Points of departure, Effect representations. | Effects can be related to each other using the toxicological concept of adverse outcome pathways (AOPs) and adverse outcome pathway networks (see https://aopwiki.org). Adverse Outcome Pathway (AOP) Networks specify how biological events (effects) can lead to an adverse outcome (AO) in a qualitative way through relations of upstream and downstream key events (KEs), starting from molecular initiating events (MIEs). Using AOPs, the adverse outcome (AO), e.g., liver steatosis, is linked to key events (KEs), e.g., triglyceride accumulation in the liver, and to molecular initialing events (MIEs), e.g., PPAR-alpha receptor antagonism. In general, multiple AOPs may lead to the same AO, and therefore AOP networks can be identified. | |
| Risks | Risks | Exposures, Hazard characterisations. | Risks (health impacts) are quantified by comparing exposures and hazard characterisations at the chosen level (external or internal) via margins of exposure (MOE) or more generalised or integrated margins of exposure (IMOE). In addition, risks can be assessed from a plot of hazard characterisations vs. exposures. |