Exposure comparisons calculation
In this module, concentration estimates from measurements in biological (human) matrices are compared with modelled or predicted concentrations obtained from dietary and/or non-dietary surveys via exposure assessments. This comparison provides insight into the coherence between modelled exposures and the measured reality. It is required that monitoring data and dietary/non-dietary exposure data are available for the same individual or individual-day. Figure 98 visualises summary statistics for the monitoring and modelled concentrations of the bisphenols BPA, BPS, and BPF.
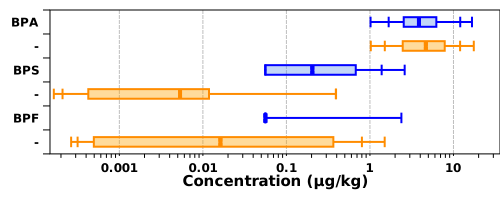
Figure 98 Boxplots for monitoring and modelled concentrations for bisphenols BPA, BPS and BPF. Lower whiskers indicate the p5 and p10 percentiles, upper whiskers the p90 and p95. The edges of the box indicate the p25 and p75 percentiles with the median in the centre of the box.
When both human monitoring data and exposure data are available for the same individuals within a population, a direct comparison can be made between the monitoring and modelled concentrations. Figure 99 shows an example of this.
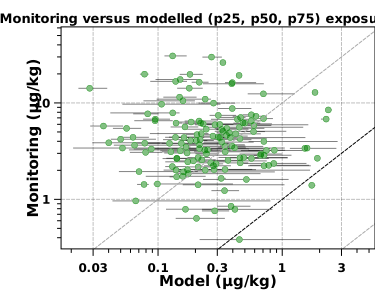
Figure 99 Monitoring versus modelled concentrations for bisphenol BPA