EuroMix generic PBK model
Reference: Tebby et al. (2020)
In MCRA updated versions (version 4b, 6) of the PBK model developed at INERIS in the framework of the COSMOS project is used. The model describes the distribution of chemicals in venous blood, arterial blood, adipose tissues, poorly perfused tissues (muscles), gut lumen, liver, richly perfused tissues (other viscera), and skin. Each of those is described as a compartment (homogeneous virtual volume) in which distribution is instantaneous and limited only by the incoming blood flow or rate of entry in the compartment. Exposure can occur through the dermal route, ingestion or inhalation. The absorbed molecules can be excreted to urine, exhaled through the lung, or metabolized in liver.
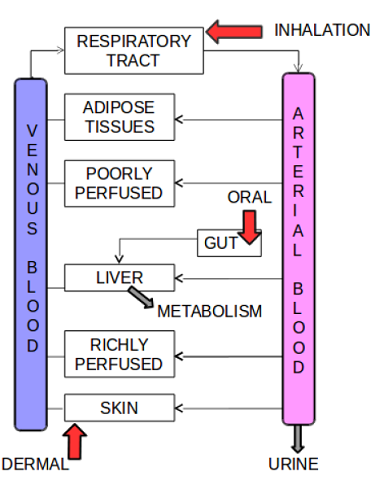
Figure 92 Schematic representation of the EuroMix Generic PBK model.
The EuroMix generic PBK model is coded as a set of ordinary differential equations. There is one such equation per time-dependent chemical quantity of the model (so-called state variables). There are 13 state variables in the model: the quantity of chemical in venous blood (\(Q_{ven}\)), in arterial blood (\(Q_{art}\)), in adipose tissues (\(Q_{fat}\)), in poorly perfused tissues (\(Q_{p}\)), in well perfused tissues (\(Q_{r}\)), in liver (\(Q_{liv}\)), in unexposed skin (\(Q_{s,u}\)), in exposed skin (\(Q_{s,e}\)), in the stratum corneum of unexposed skin (\(Q_{sc,u}\)), in exposed stratum corneum (\(Q_{sc,e}\)), in gut lumen (\(Q_{gut}\)), the quantity excreted to urine (\(Q_{ex)}\), and the quantity metabolized (\(Q_{met}\)). The model can predict, as a function of time, for given oral, dermal and/or inhalation exposures, all the above quantities and the corresponding concentrations as a function of time. Concentrations are obtained by dividing quantities by compartment volumes Tebby et al. (2020).
In Figure 93 a time course of the internal substance amount (\(\mu g\)) for Clothianidin in the liver is shown. For 50 consecutive days a bolus per day is submitted. The red line shows the substance amount varying over time. The green line displays the average of the peaks representing acute exposure, the blue line displays the steady state representing chronic exposure, all after skipping a nonstationary period of 10 days (the vertical black line).
From the substance amount, a concentration is computed by dividing it by the total compartment weight (i.e., the mass/volume of the compartment/organ).

Figure 93 Time course of exposure (\(\mu g\)) for Clothianidin in the liver (EuroMix generic PBK model version 6).
In Figure 94, for a large number of individuals the internal exposure (acute, green dots) in the liver is plotted versus the external exposure (\(\mu g / kg bw\)). The diagonal represents the 1:1 ratio of internal vs external exposure.

Figure 94 Internal versus external exposure for Clothianidin in the liver (EuroMix Generic PBK model version 6).