Results panel
The output of all runs is shown in the results panel. By clicking the hyperlink of an output section the output is opened in the browser. Most output tables have three icons. Click the left icon to download the table in csv format, click the middle icon to sort table columns or multiple columns (sort column, press/hold shift and sort next column) or to filter (search box). Press the question mark for additional information about the table headers.
All plots and charts can be saved by right clicking the picture.
An easy way to compare multiple outputs is to select a few outputs as shown in Figure 30, then click om the three dots and click Compare selected.
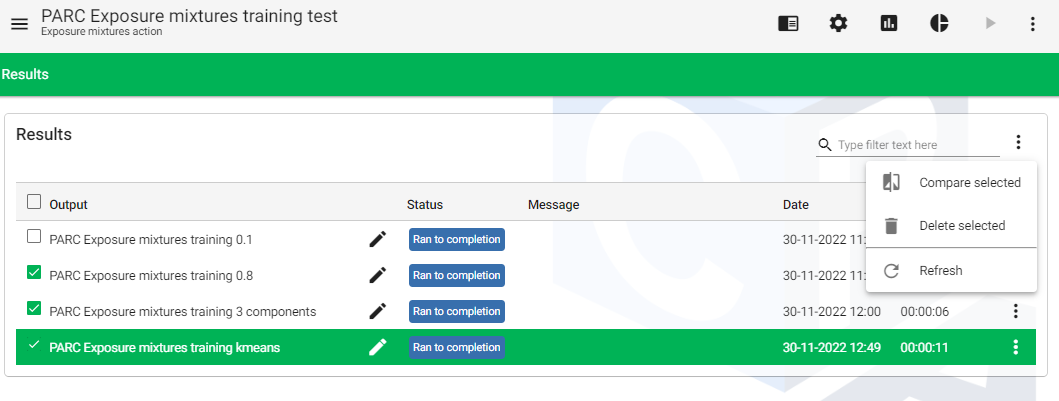
Figure 30 Compare selected outputs
A new panel pops up and each output section can be reached by clicking the output name, e.g., PARC Exposure mixtures training 0.8. Expand the tree on the left side and select the sections you want to compare. In Figure 31, Concentrations by substance is selected in the Human monotoring analysis sub-action. Navigate to the output by clicking name of the output sections e.g., PARC Exposure mixtures training 0.8.
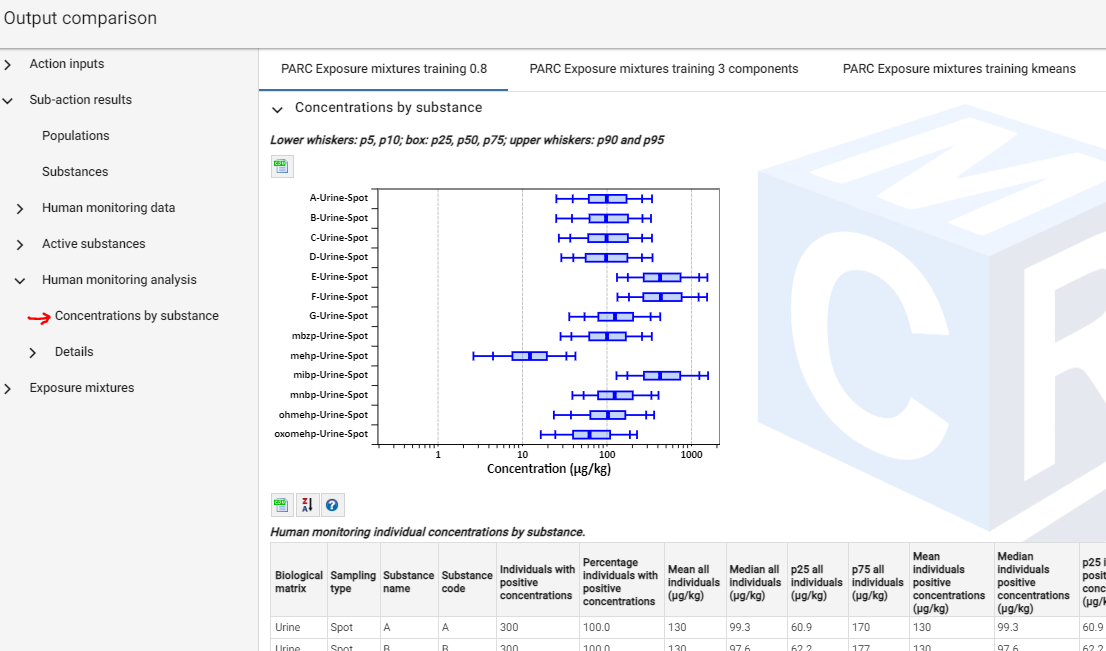
Figure 31 Output comparison panel