Multiple surveys
In the Consumption panel, consumption data sources are selected. After selecting two or more data sources (add another data source), MCRA performs a loop over the selected surveys, see Figure 44. Check Loop over multiple surveys.
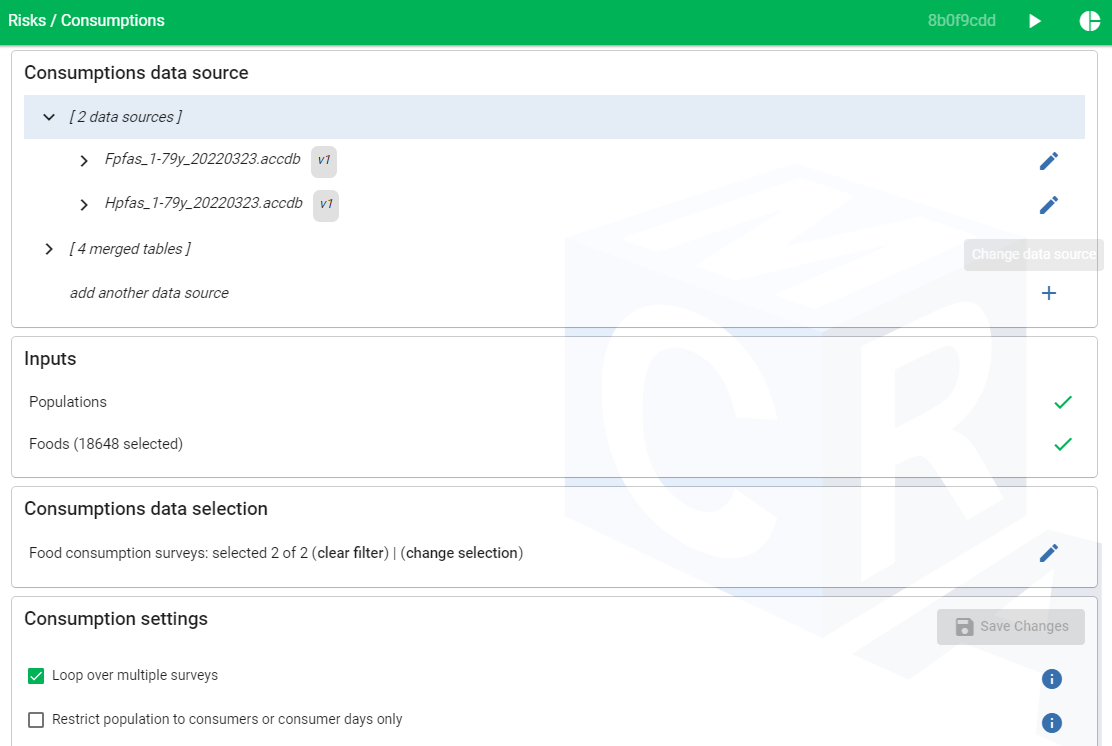
Figure 44 Loop over multiple surveys.
The advantage of running a multiple survey loop instead of running separate actions for each surveyn is that outputs are directly compared. In the Results panel, Figure 45, a toc appears containing links to the output of the risk or dietary exposure assessment (main action) for the selected surveys, but also a link to the combined output panel.
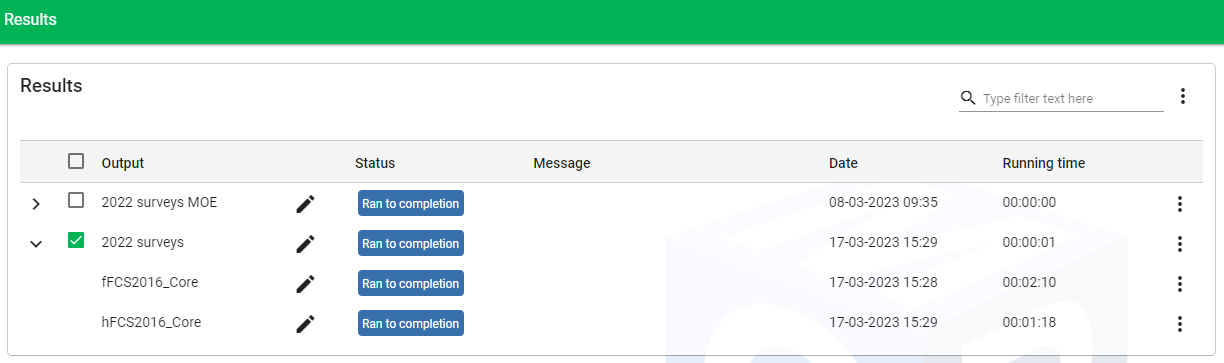
Figure 45 Results panel multiple surveys.
After clicking the link 2022 surveys, the combined output is represented in violin plots and a table with percentiles for the specified percentages. Here a combined risks action is run and the p99 of the hazard index distribution is selected. For a dietary exposure action similar results are available.
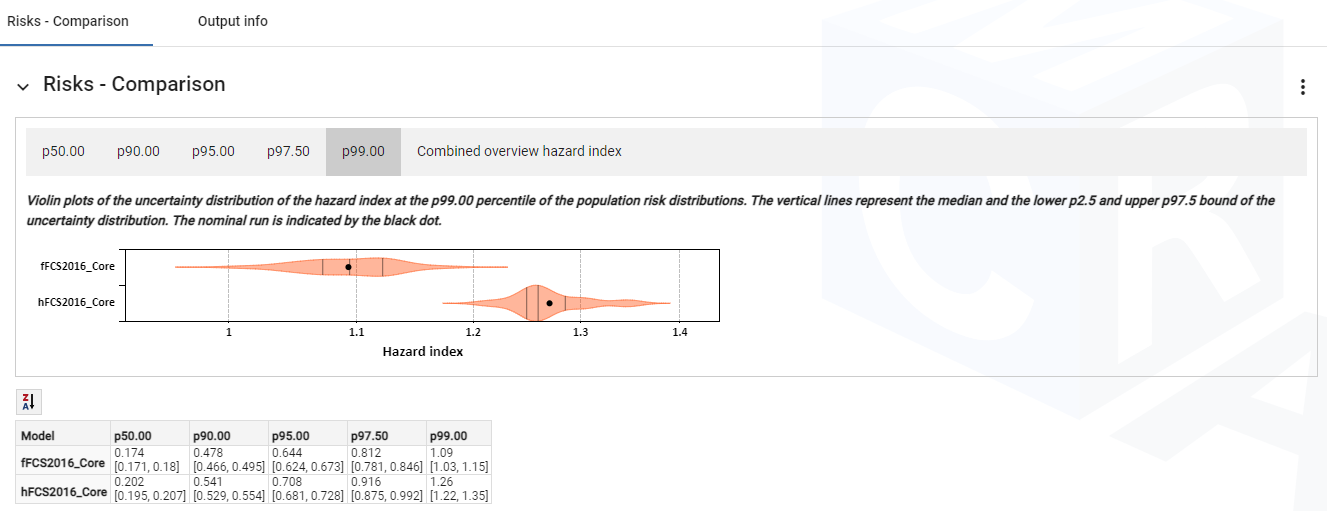
Figure 46 Risks comparison multiple surveys.